Open Source Circuit Board Statistics
I’ve been spending a lot of time thinking about ViaGrid1 2, a standard for rapid PCB manufacturing. Current UV DPSS fiber lasers have the ability to ablate copper on FR4 really well, hitting trace/space marks comparable to commercial fabs. However, there isn’t a good way to make vias at home. The idea of ViaGrid is to pre-manufacture a bunch of boards with vias already in place, so that you can later isolate them and incorporate them into your designs. This is a really interesting thing for a makerspace to have: the ability to rapidly create new PCBs in-house with design rules similar to production boards. My two local makerspaces3 4 have plenty of members doing PCB work, and I think an end-to-end class where you can make boards in one sitting would be compelling, and get more people designing and manufacturing their own circuit boards. One question that stood out to me was: what’s the right size viagrid board? How many vias is enough? How big should it be? I got curious and wanted to compute some statistics.
My objective was to compute the distribution of size and number of vias from publicly available circuit board designs.
TL;DR
The median KiCAD or EAGLE PCB on Github has eight vias, and is 50x42mm. The 90% percentile KiCAD or EAGLE PCB on Github has 75 vias, and is 125x100mm. This is from an analysis of 954 PCB designs. This is not an exhaustive evaluation of publicly available boards, and future work will consider a greater number of PCB designs.
Data Sources
The board designs for this study were collected using the Github search API. I
searched for files with the file extension kicad_pcb or brd, targeting KiCAD
and EAGLE PCB files. The Github search API can return a maximum of 1000 results,
so I got 1000 board designs per file type. Some files show up multiple times in
the search results (not sure why), so I got ~630 boards per type. Some of these
board files were empty, and some of the brd files were not EAGLE PCBs, so in
total I got 954 valid boards. I computed three metrics per board:
- Width: distance between the farthest right and farthest left item on the
Edge.Cutslayer in KiCAD, or layer 20 in EAGLE XML. - Height: distance between the farthest up and farthest down item on the
Edge.Cutslayer, or layer 20 in EAGLE XML. - Vias: number of vias. Through-hole pins were not included in this total.
Results and Analysis
I computed the empirical cumulative distribution function (ECDF) for the board width and height:
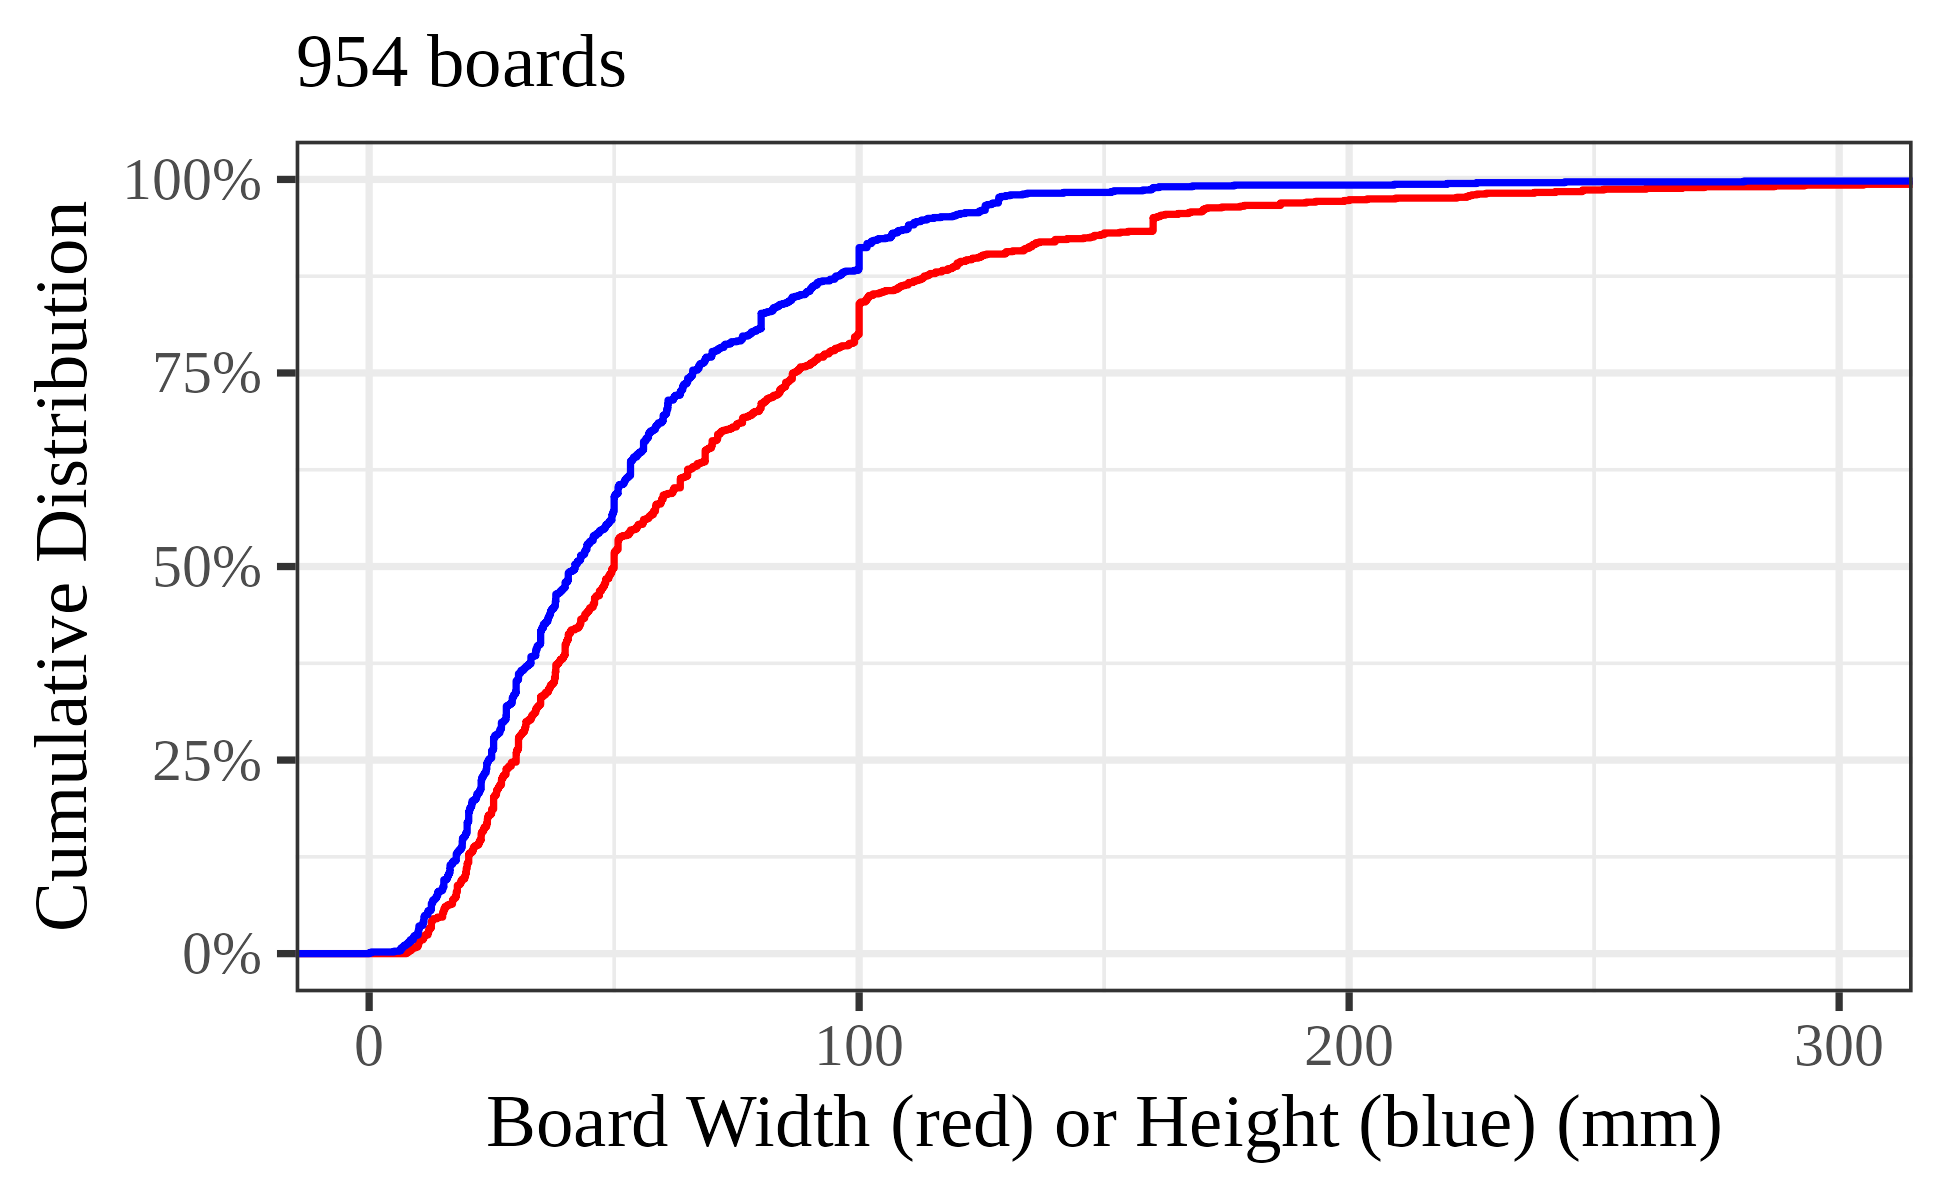
Side note: ECDFs are a powerful tool for understanding the distribution of a data value, but take a little getting used to if you’ve never read one. Data points are sorted from left to right, and each one bumps the line up by
1/N, when there areNdata points, so the right side of the line will be at 1 (or 100%). A tall spike or steep line indicates a common value/range; a shallow area indicates a range of uncommon values. Percentiles (like the median at 50%) can be read by moving across from the Y axis and seeing where the ECDF crosses that particular threshold. If you like calculus and histograms, you can imagine the derivative of an ECDF is a histogram.
Some interesting things that jump out to me:
- Boards seem to be wider than tall. 64% of boards had a greater width than height.
- Boards smaller than ~12mm on a side are pretty uncommon.
- The median width is 50mm and the median height is 42mm. This doesn’t actually mean the median board is 50x42, the boards that are 50mm wide could tend to be taller/shorter/etc, but I don’t think I’m doing too much harm in making that simplification.
- Some sizes, like 50mm and 100mm, seem to be more common than others. However, there are a whole lot of boards whose size is not an even number in metric.
- There are some very large boards out there. Largest width was 617mm and largest height was 785mm.
I also computed the distribution of via count:
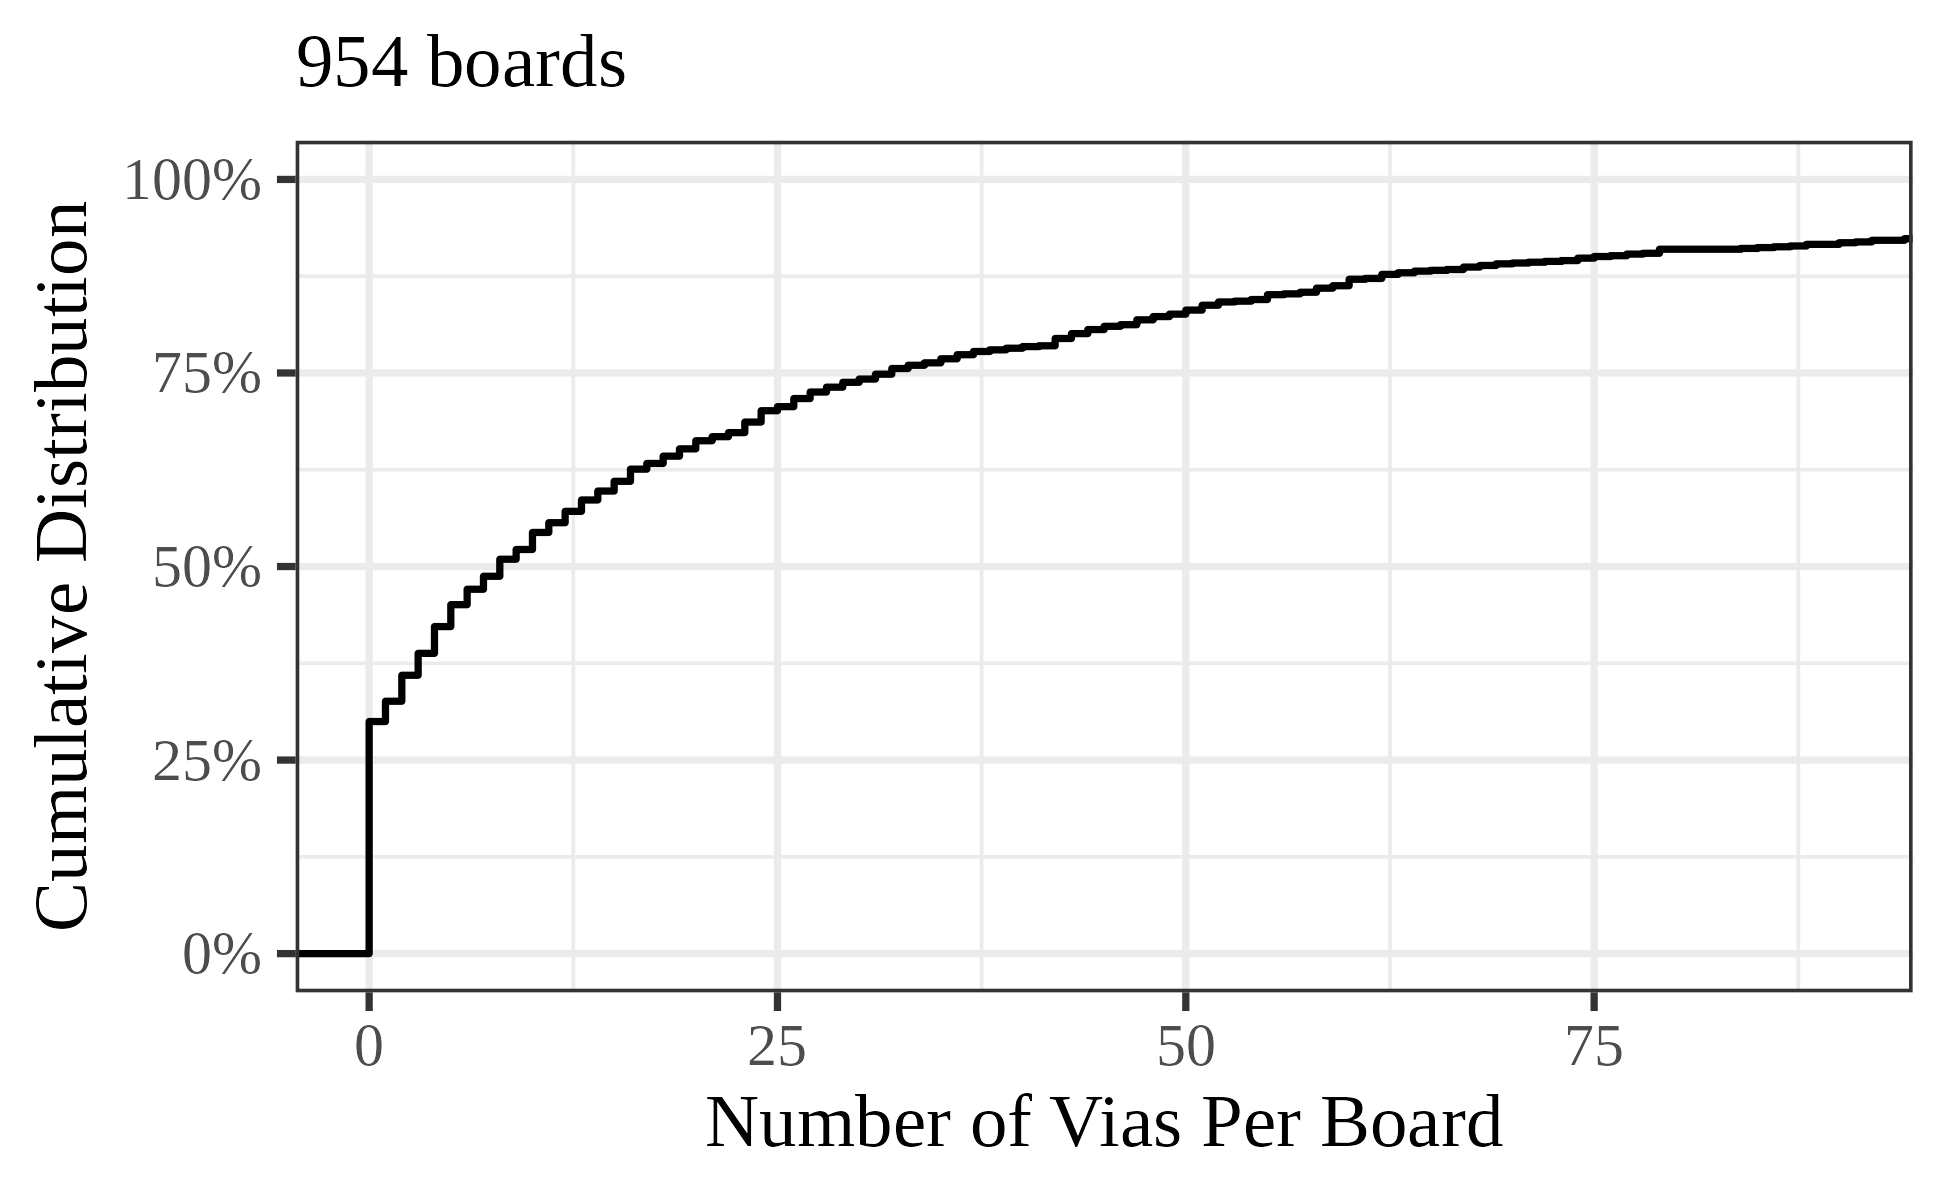
Some interesting things that jump out to me:
- More than 25% of board designs have no vias.
- The median board has eight vias, much less than the Viagrid boards.
- The Viagrid 9055 board has more vias (180) than 97.4% of boards in my sample.
- The board with the most vias had 600 vias.
I also computed the distribution of center-on-center distances between a via and its nearest neighbor:
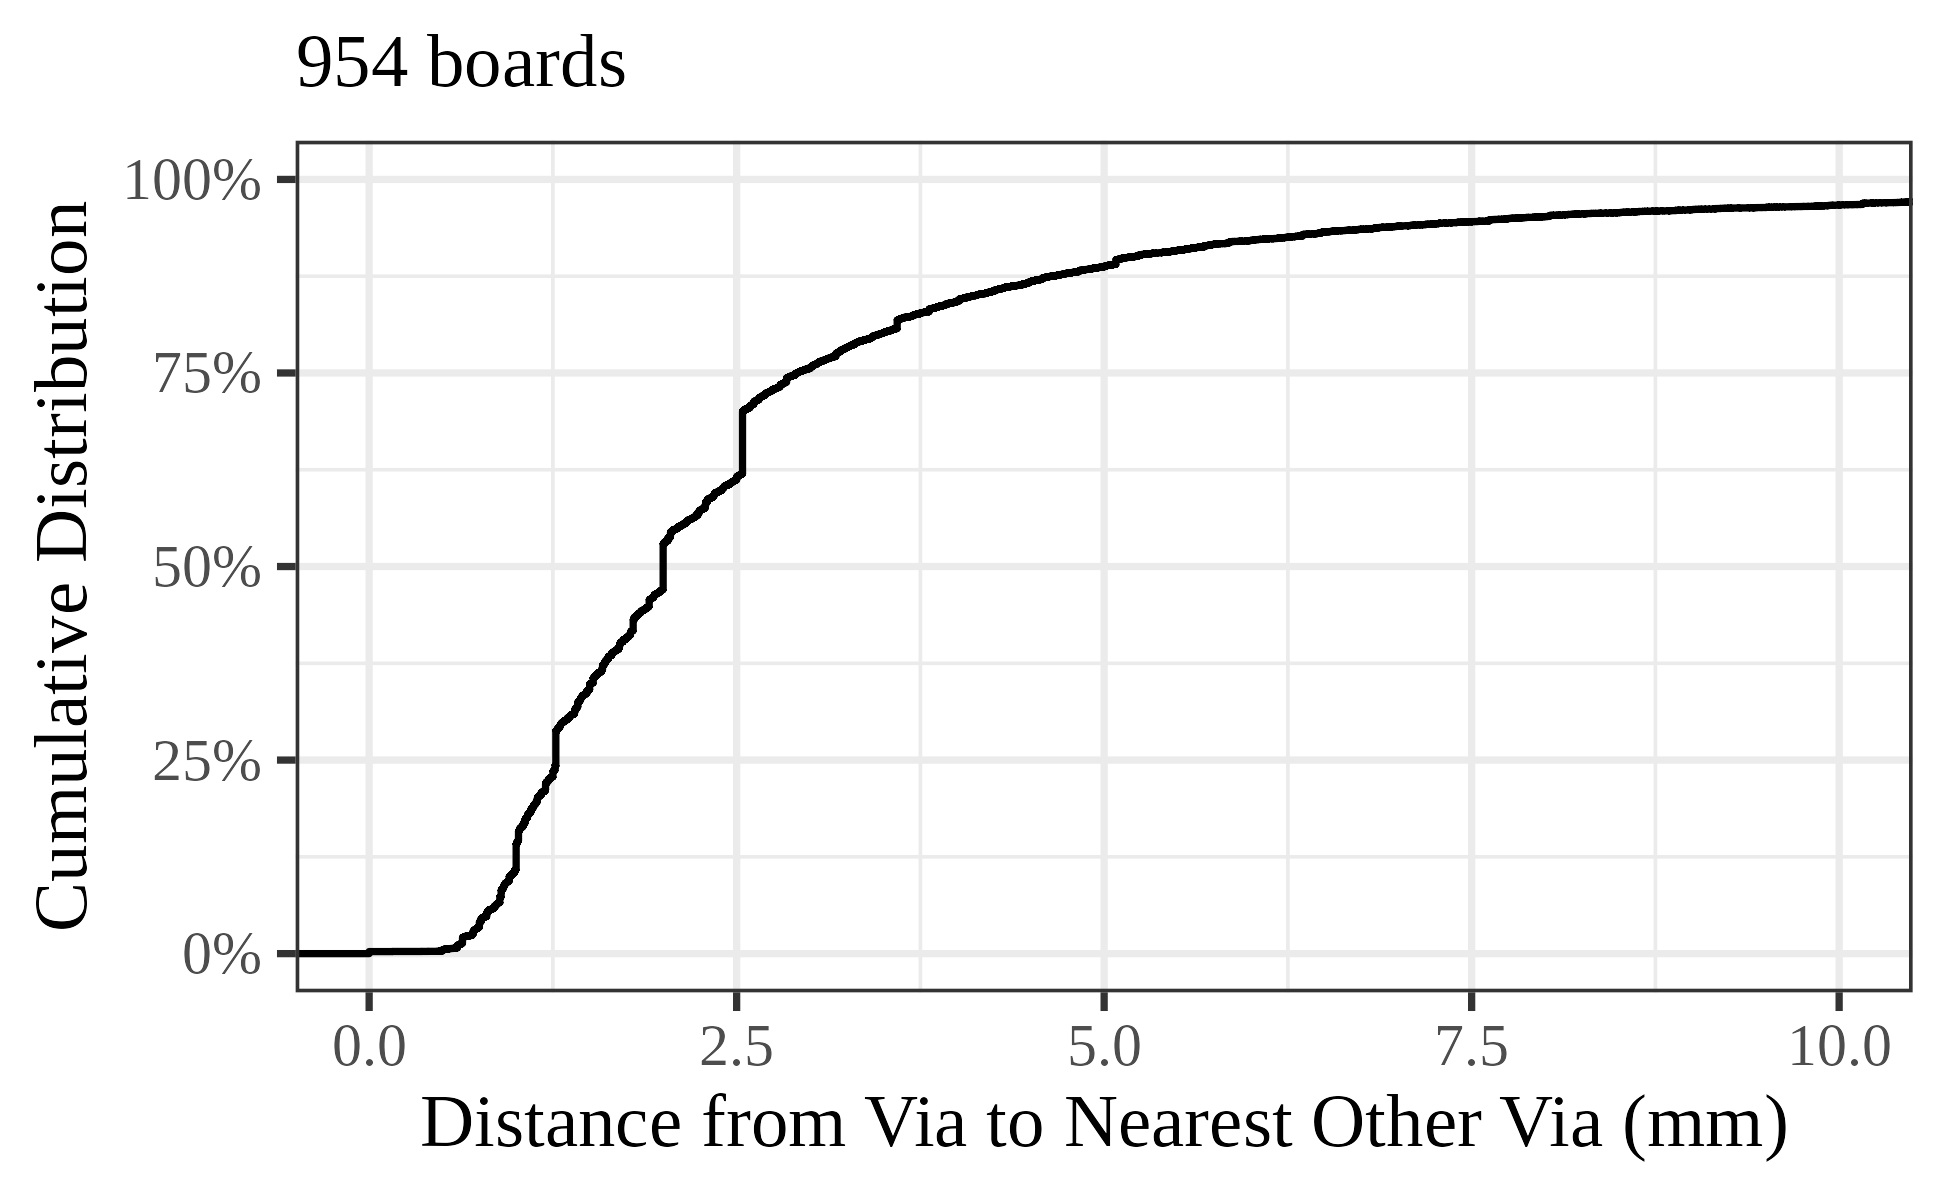
Some things I noticed:
- Lots of vias are very close to each other. Median via is 2mm away from another via.
- Some common values are present, which makes me think there is via stitching.
- There’s a little bump at 0mm, I guess some files have vias on top of one another.
I re-ran this on boards with fewer than 50 vias, which is roughly where the curve starts flattening out on the via count graph:
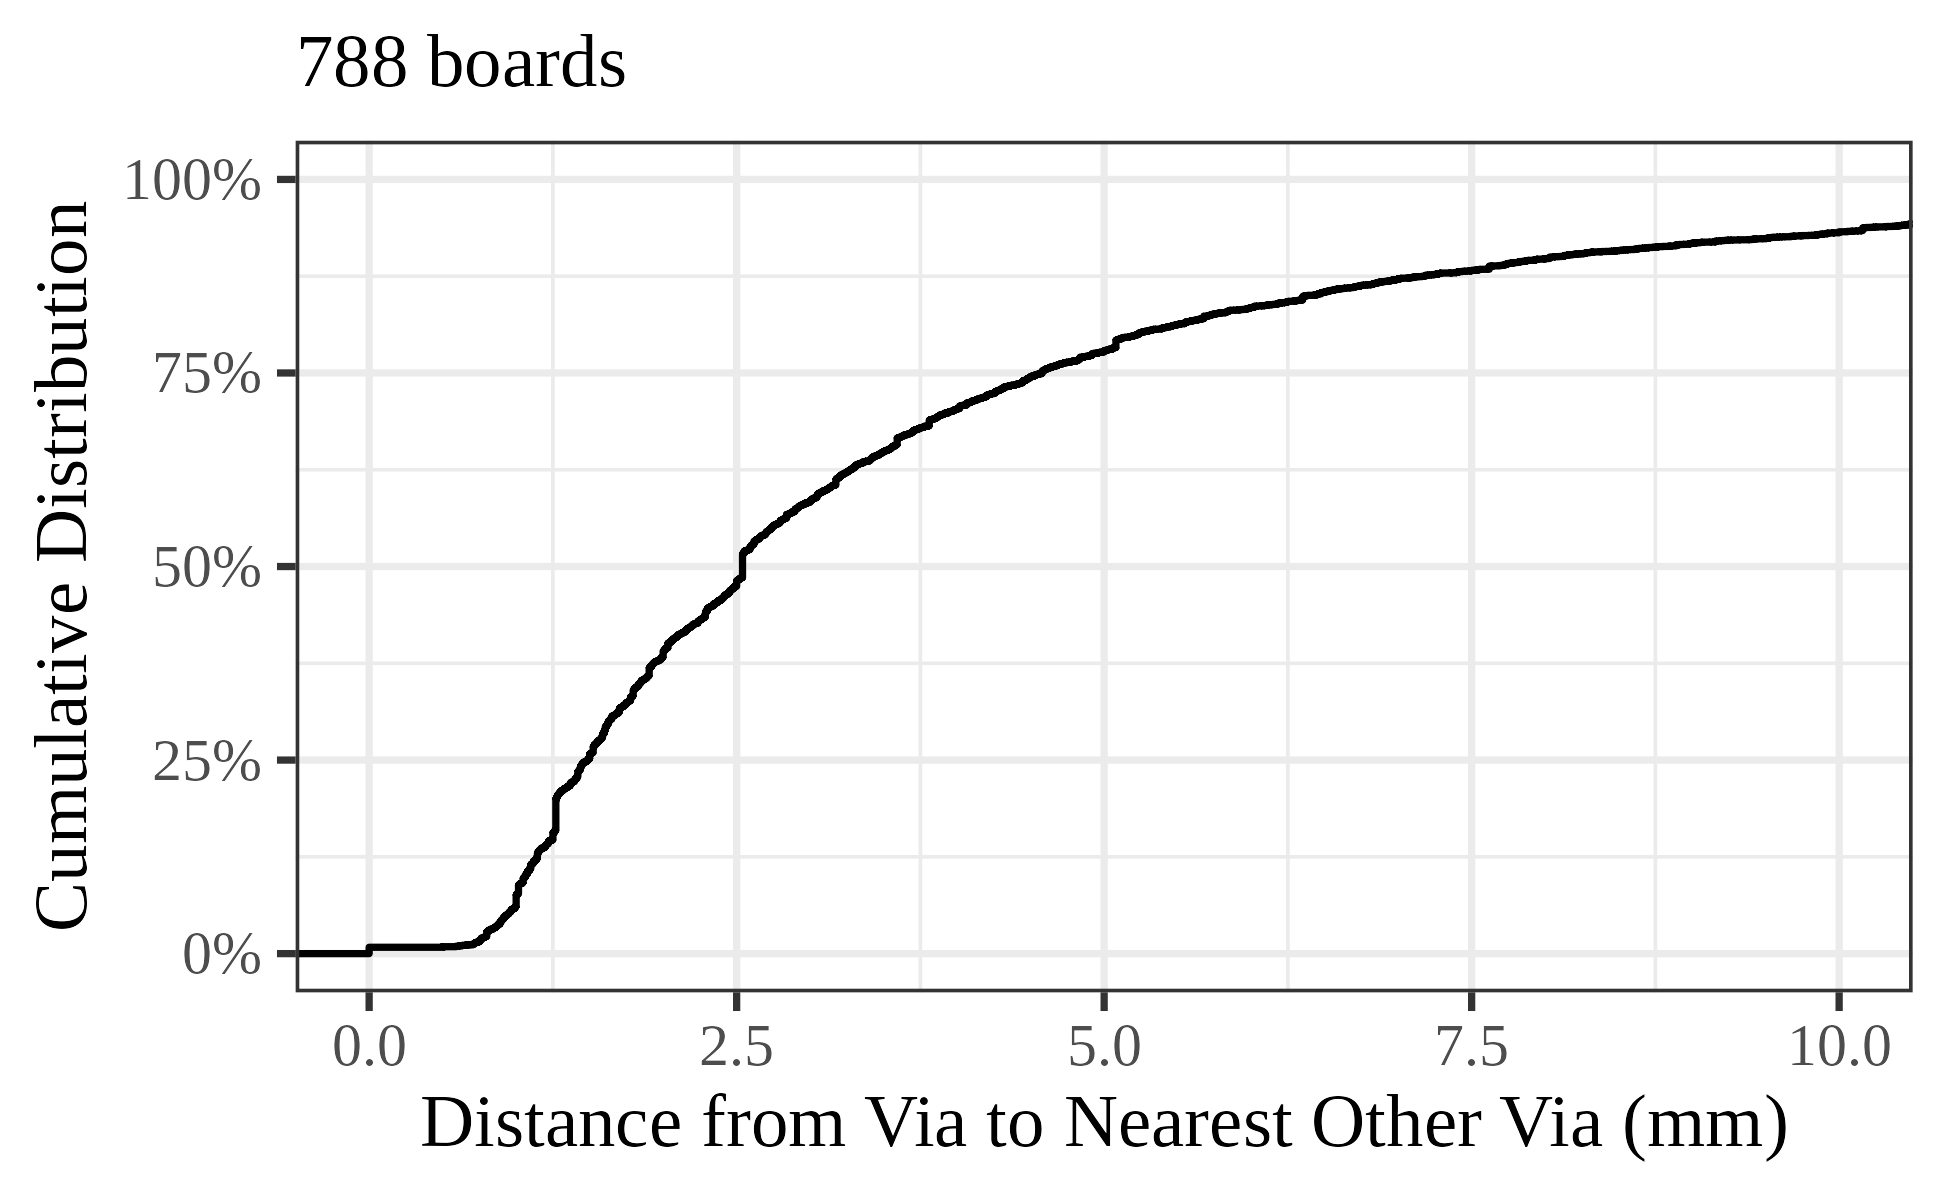
The graph is similar, but shifted to the right. The median via is 2.54mm (0.1in) away from another via, for boards with fewer than 50 vias.
Conclusion and Future Work
I know I’m missing a bunch of boards due to the 1000-file limit from Github search. One other potential dataset is the Github file scrape that’s in Google BigQuery. This was last updated in November 2022, so there aren’t going to be a ton of KiCAD designs in there in the modern file format, but there should be a lot of EAGLE designs. The main reason I did not include data from BigQuery is that it was going to cost around $20 to run a query due to the amount of data processed, which I didn’t want to deal with. If this analysis proves insufficient or someone is more financially unrestricted than I am, I could do the analysis on a larger collection of board designs. I could also get board files by scraping the list of OSHW projects and finding their board files, but this information is not stored in a standardized way, so scraping and collating the data would be a lot more work.
This was an interesting look at publicly available board designs; hopefully this can inform the design of future ViaGrid standards. If you have questions / comments about this, please reach out in the viagrid channel on the LumenPnP Discord, or Hacker News comments, if anyone posts it there.
AI Statement
Claude and Gemini were used to write the downloader and data extractor in python. I wrote the data analysis in R and all of this text by myself.